The Cost of Living in the United States
By Renae Wang 11/1/25
I was curious as to whether the cost of living was correlated with other characteristics of each state within the United States and the significance of the cost of living.
I looked into whether different tax levels (sales and income), different geographic regions, and income levels could be indicators of high cost of living. Then I explored whether all of this deep dive into potential markers of the cost of living even mattered by seeing whether the cost of living even had that much variation between states.
Through this journey, I've concluded that the cost of living and tax range only correlated slightly. The biggest indicator of high cost of living was a high average income. But in the end, the data points to the fact that the cost of living variations between states isn't very high with the only exceptions being Hawaii, California, and Massachusetts. But even then, when analyzing the pie chart, the cost of living appears to be pretty even across all the states within the US. Therefore, whether a person wants to live in New York or Texas, the cost of living is different, but not extremely significant. Other factors like quality of life or career prospects should be weighed with more consideration over cost of living.
| State |
2025 Cost of Living Index |
Average Income (Annual) |
| Alabama |
88 |
$55,350 |
| Alaska |
123.8 |
$72,810 |
| Arizona |
111.5 |
$65,740 |
| Arkansas |
88.7 |
$53,070 |
| California |
144.8 |
$79,900 |
| Colorado |
102 |
$46,958 |
| Connecticut |
112.3 |
$76,050 |
| Delaware |
100.8 |
$67,640 |
| District of Columbia |
141.9 |
$109,420 |
| Florida |
102.8 |
$62,990 |
| Georgia |
91.3 |
$64,210 |
| Hawaii |
186.9 |
$68,280 |
| Idaho |
102 |
$58,440 |
| Illinois |
94.4 |
$69,020 |
| Indiana |
90.5 |
$58,800 |
| Iowa |
89.7 |
$58,350 |
| Kansas |
87 |
$58,230 |
| Kentucky |
93 |
$56,310 |
| Louisiana |
92.2 |
$55,130 |
| Maine |
112.1 |
$63,760 |
| Maryland |
115.3 |
$76,130 |
| Massachusetts |
145.9 |
$83,050 |
| Michigan |
90.4 |
$63,120 |
| Minnesota |
95.1 |
$68,880 |
| Mississippi |
87.9 |
$49,740 |
| Missouri |
88.7 |
$59,630 |
| Montana |
94.9 |
$58,160 |
| Nebraska |
93.1 |
$60,230 |
| Nevada |
101.3 |
$60,310 |
| New Hampshire |
112.6 |
$68,800 |
| New Jersey |
114.6 |
$76,320 |
| New Mexico |
93.3 |
$60,290 |
| New York |
123.3 |
$80,630 |
| North Carolina |
97.8 |
$62,440 |
| North Dakota |
91.9 |
$61,810 |
| Ohio |
94.2 |
$62,280 |
| Oklahoma |
85.7 |
$54,960 |
| Oregon |
112 |
$70,290 |
| Pennsylvania |
95.1 |
$63,690 |
| Rhode Island |
112.2 |
$69,270 |
| South Carolina |
95.9 |
$56,990 |
| South Dakota |
92.2 |
$55,480 |
| Tennessee |
90.5 |
$58,700 |
| Texas |
92.7 |
$63,660 |
| Utah |
104.9 |
$63,960 |
| Vermont |
114.4 |
$66,330 |
| Virginia |
100.7 |
$72,060 |
| Washington |
114.2 |
$81,550 |
| West Virginia |
84.1 |
$54,940 |
| Wisconsin |
97 |
$61,690 |
| Wyoming |
95.5 |
$60,200 |
Note: The Cost of Living Index is a percentage that compares an area's cost of living in relation to the average cost of living of all areas analyzed combined. So in the United States, each state's cost of living index is that state's cost of living as a percentage of the average cost of living across the Untied States.
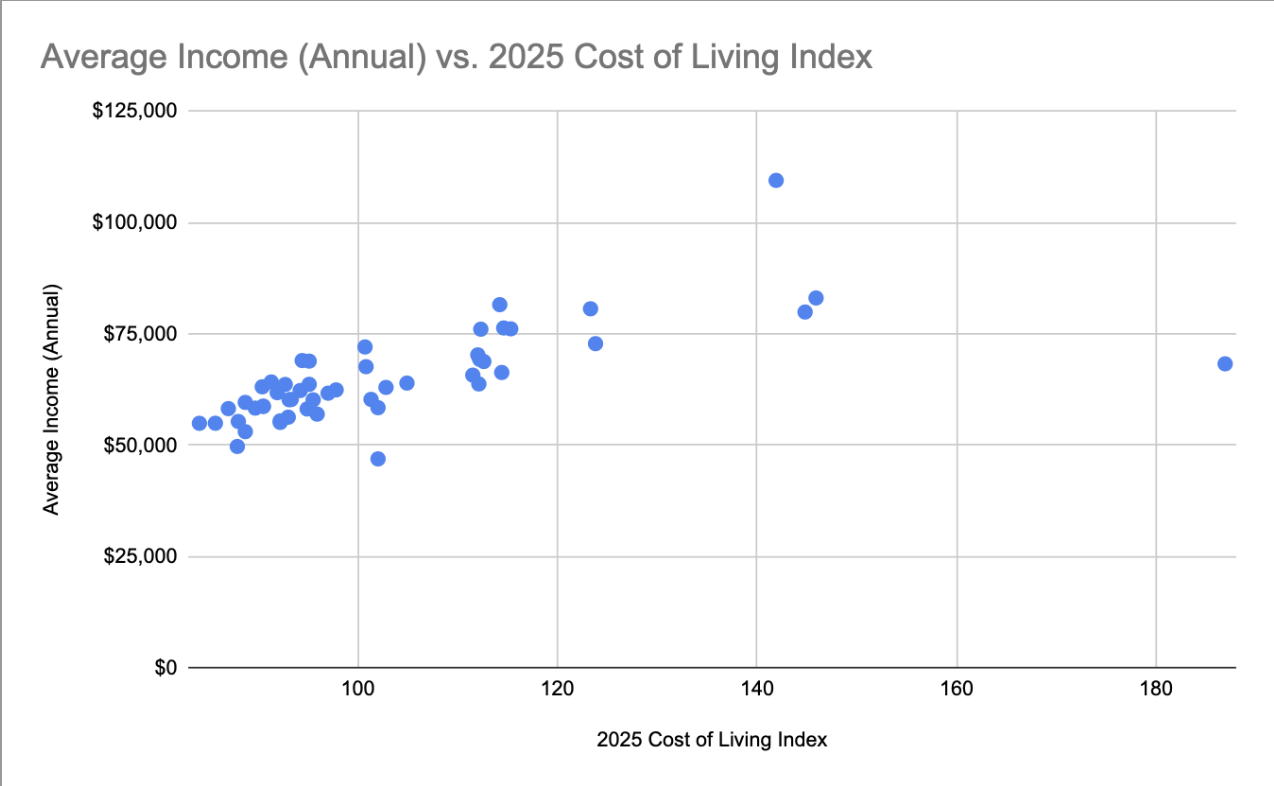
The strongest indicator of a high cost of living in each state that I've found was each state's corresponding average annual income.
As indicated by the scatterplot chart below, there appears to be a significant positive correlation between average annual income in each state and the cost of living.
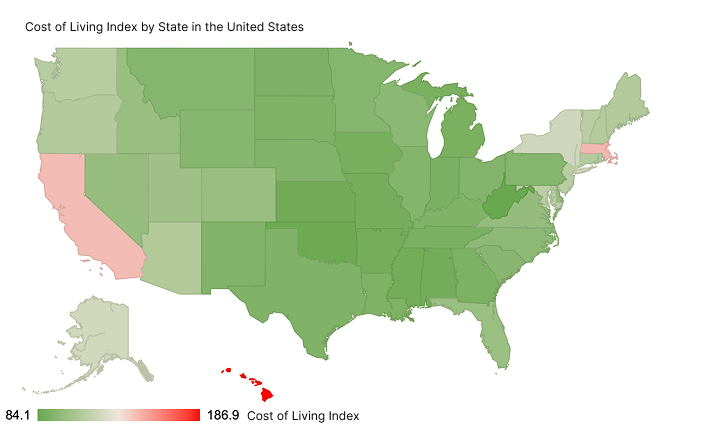
This map that indicates the correlation between the cost of living and geographic location suggests that coastal regions tend to have higher costs of living whereas the cost of living lowers as the states are more inland.
This heatmap that shows the extent of the cost of living in the United States through progressive color variations from green (low cost of living) to red (high cost of living) shows every state as green with the exceptions of California, Hawaii, and Massachusetts. There seems to be no correlation as to whether the longitude or latitude of these states affects the cost of living. Though, the aforementioned red states are all coastal states, indicating that coastal regions tend to require higher costs to live in.
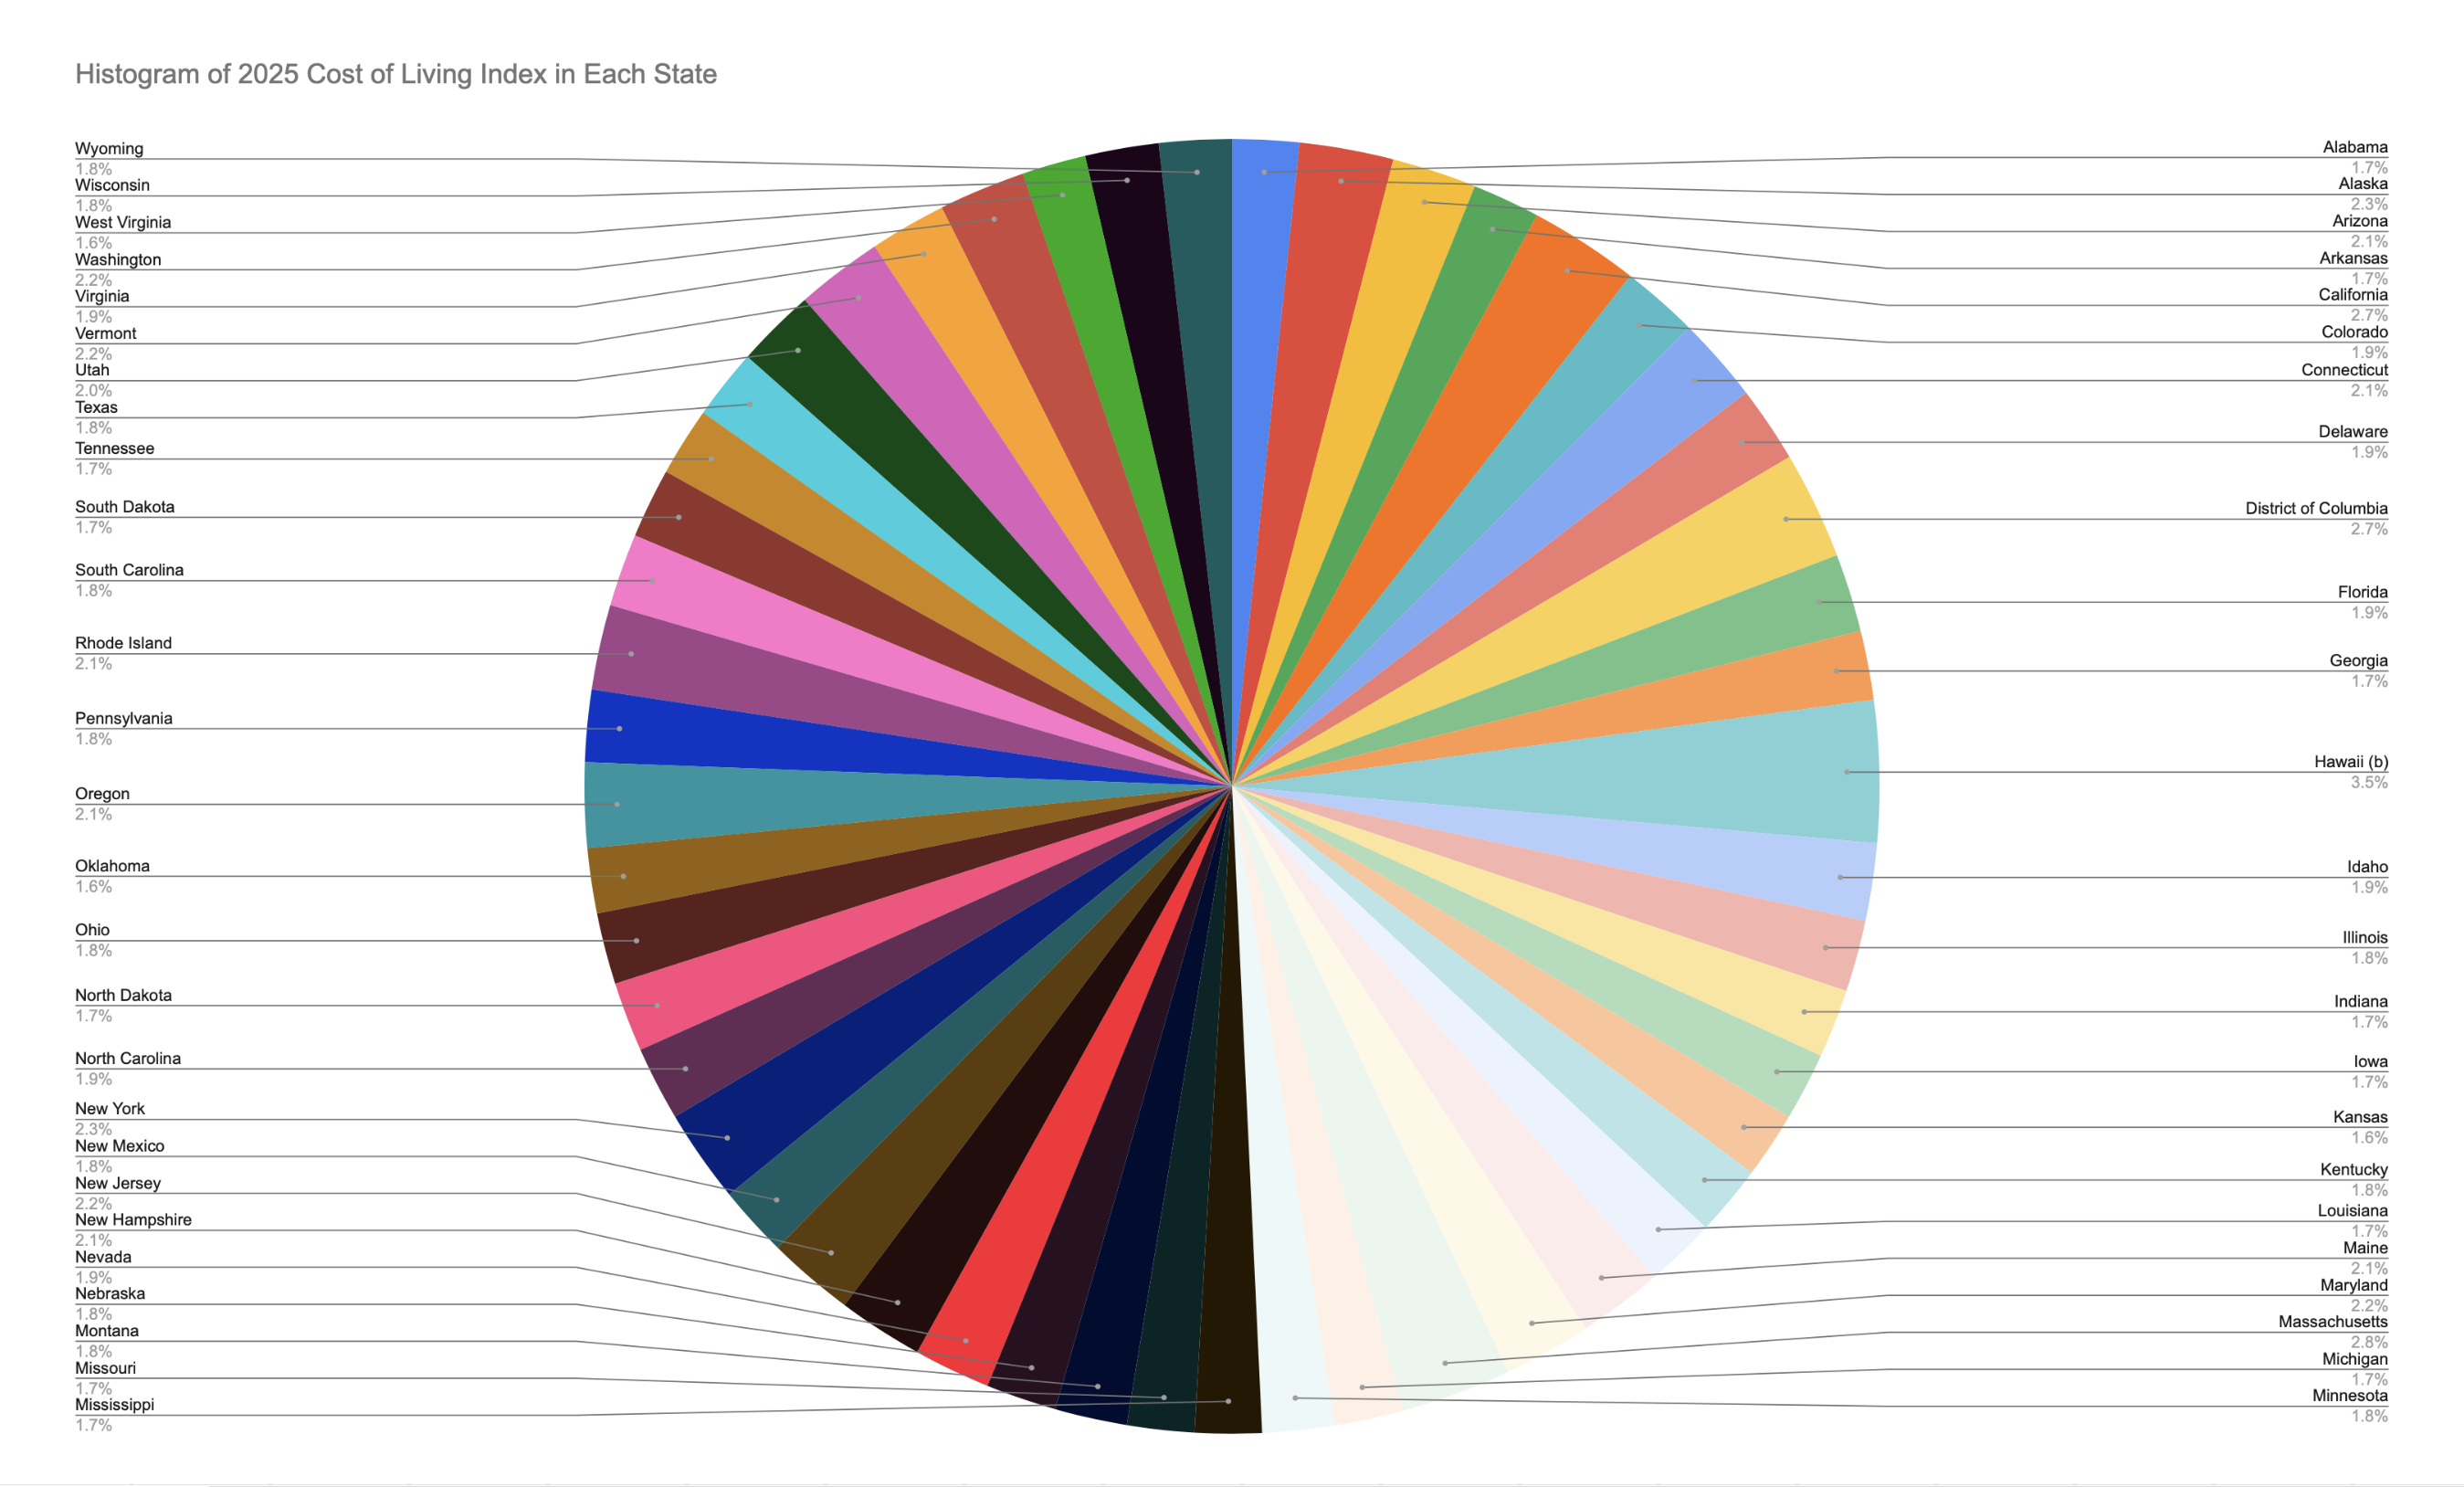
But even then, when all the states are compared to each other in terms of the cost of living index on a pie chart, the cost of living variations are very limited, suggesting that this variation is not as important when determining whether a person should live in a state or not.
The pie chart of all the states and their corresponding cost of living index shows a very even distribution of this metric across all fifty states. And taking into consideration that the average annual income for each of these states increases with larger cost of living tends to make up for the loss that would have taken place if one is to move in a state with higher costs.